 AidBio
Maize · Feb 18, 2022 – Jul 05, 2022 · 138 days · rainfed · planted 2022-02-18 · harvest 2022-07-05
Rainfall was 213 mm, 46% below the baseline mean while average temperature ran 0.7 °C above baseline mean
AId Summary. Rainfall of 213.3 mm combined with an atmospheric demand of 467.3 mm produced a negative climatic balance of –163.3 mm, indicating that atmospheric demand exceeded supply during the season. The mean temperature of 20.6 °C, above the 1991–2020 mean of 19.9 °C, contributed to higher evaporative demand and a cumulative thermal time of 1464.0 °C‑day, slightly above the normal 1449.0 °C‑day. These conditions suggest that a rainfed maize crop faced a climate with higher demand and warmer accumulation than typical.
Location & Period
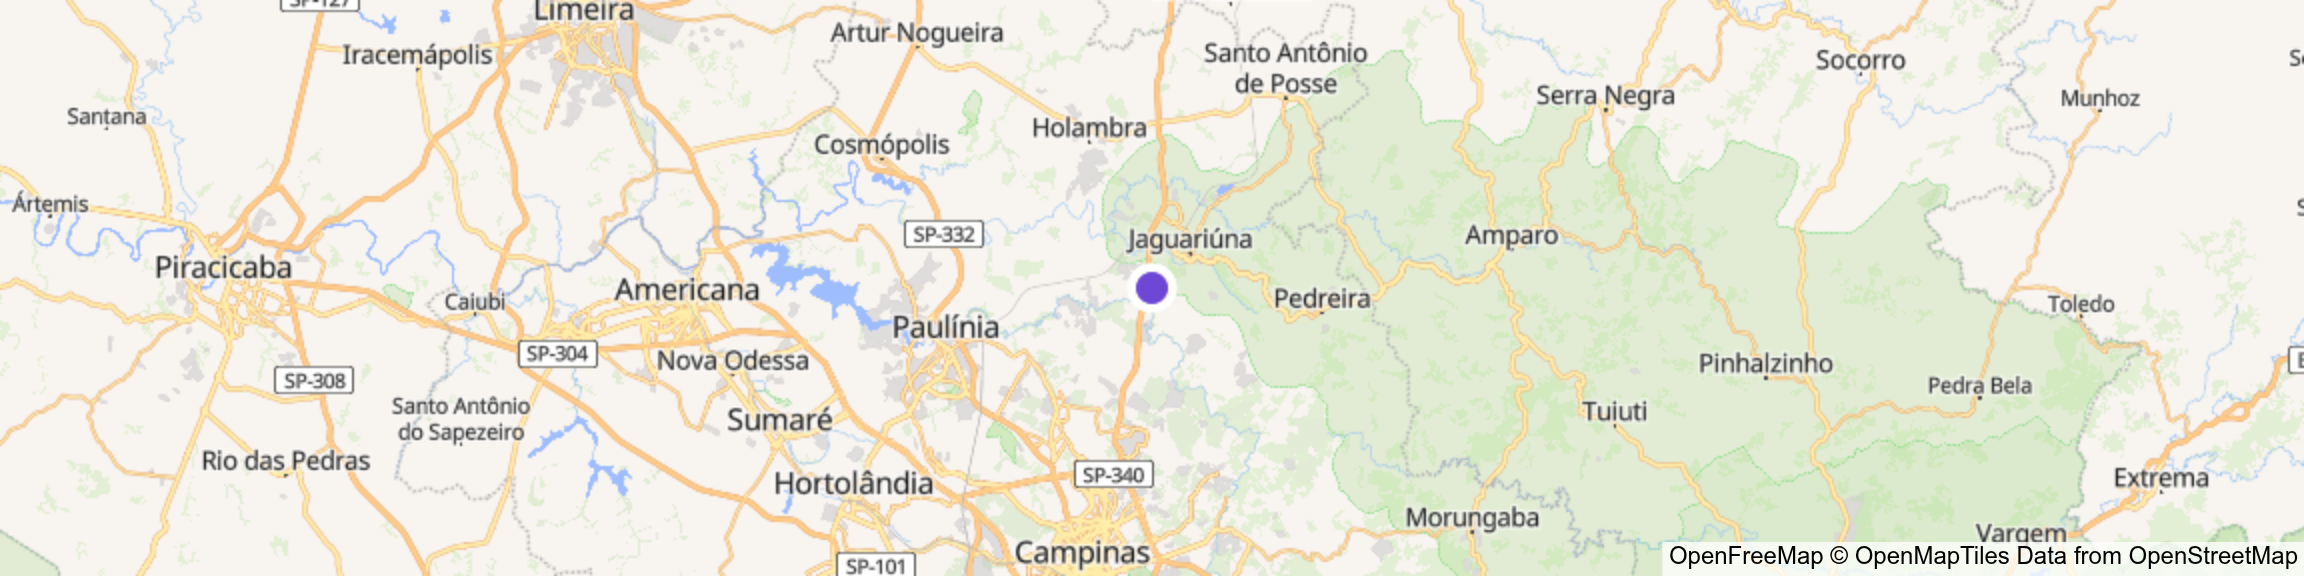
 NASA POWER via AidBio aidweather GitHub ↗
Temperature and accumulated heat
Temperature sets the pace of crop development and the balance between growth and respiration. The daily extremes show the range plants lived through; growing degree-days add up the heat available for development, the thermal time agronomists use to follow a crop through its season. Heat is counted above the Maize base of 10 °C.
AId Summary. Mean temperature of 20.6 °C exceeds the 1991–2020 mean of 19.9 °C, indicating a warmer season. Accumulated heat above the maize base reached 1,464 °C·day, surpassing the normal accumulation, so thermal time progressed faster. The excess heat suggests that maize development could advance relative to a typical season, prompting the agronomist to verify whether crop phenology aligns with expected dates.
Comparisons
- Mean temperature: 20.6 °C
- Accumulated heat: 1,464 °C·day above 10 °C (Maize base)
- Normal mean temperature (1991–2020): 19.9 °C
- Normal accumulated heat (single sine): 1,449 °C·day
Rain and water demand
Rain is the supply side of the crop water budget and evapotranspiration the demand side. Following both through the season shows when a surplus or a shortfall built up and how early it began, which is when a rainfed crop is most exposed.
AId Summary. Maize crop water need for the period was 376.6 mm, while precipitation was only 213.3 mm, producing a climatic balance of −163.3 mm that indicates atmospheric demand surpassed supply. The longest consecutive dry period lasted 15 days, reinforcing that rainfall was spread over short spells rather than sustained. These conditions suggest that the crop would require supplemental irrigation to meet its evapotranspiration demand.
Comparisons
- Total precipitation: 213.3 mm over 138 days
- Crop water need (ETc): 376.6 mm over the same days
- Rain minus crop water need: −163.3 mm (climatic balance, not soil moisture)
- Normal rain for this window (1991–2020 mean): 395 mm; this season is −46% against it
- Longest run of days under 1 mm: 15 days; 5 dry spells of at least 7 days
Atmospheric drying demand (VPD)
Vapour pressure deficit (VPD) measures how strongly dry air draws water from leaves and soil. High VPD speeds transpiration and pushes plants to close their stomata, which also limits carbon uptake: it is the atmospheric side of water stress.
AId Summary. Peak‑demand VPD reached 2.88 kPa, well above the generic 2 kPa reference, and 47 of 138 days exceeded that threshold, indicating sustained high transpiration demand. The average 24‑hour VPD of 0.64 kPa suggests that most of the period was relatively moist, but repeated excursions above 2 kPa could prompt stomatal closure and elevate hydraulic risk when soil moisture is limited. These conditions may limit carbon uptake in maize, which is already sensitive to high temperatures.
Comparisons
- Peak-demand VPD (estimated): mean 1.86 kPa, period maximum 2.88 kPa
- Days above the 2 kPa generic reference: 47 of 138
- 24 h mean VPD: 0.64 kPa
Stress-event calendar
Seasonal totals can hide timing. This calendar marks every day on which a stress condition occurred, so clusters of heat, dry spells or cool nights can be lined up with the crop's sensitive stages. For Maize, the crop registry lists flowering/silking, grain filling as the stages most sensitive to heat and water.
AId Summary. Peak‑demand VPD occurred on 47 days, indicating sustained high evaporative demand. Five dry spells added low precipitation, compounding the VPD pressure. Twelve nights fell at or below the maize base temperature, reflecting cooler periods that could reduce transpiration. The combination of high VPD days and extended dry spells suggests that the crop experienced periods of elevated atmospheric demand during the season.
Comparisons
- Dry spells of at least 7 days: 5 (58 days)
- Days with peak-demand VPD above 2 kPa (generic reference): 47
- Nights at or below 10 °C (Maize base): 12
- Days at or above 35 °C (generic reference): 0
- Coldest night 3.2 °C; hottest day 32.1 °C; frost days (Tmin < 0 °C): 0
Appendix · supporting variables, crop context and glossary
Crop context — Maize
Thermal time accumulates from the planting date and stopping at the harvest date (20220705) using the sourced base 10 °C (medium confidence), upper cutoff 30 °C. Accumulated: 1,464 °C·day. It is a thermal-time indicator, not a phenological stage.
Solar radiation
Incoming solar radiation is the energy behind photosynthesis and evaporation. Cloudy spells lower both the potential for growth and the drying power of the air.
AId Summary. Mean solar radiation 17.32 MJ m⁻² day⁻¹ provides energy for photosynthesis and drives evapotranspiration. For maize, developmental rates are governed between 10.0 °C and 30.0 °C; thus, the radiation is available when temperatures fall within this window, allowing the crop to translate light into growth. The mean radiation likely increases evaporative demand, suggesting that irrigation scheduling should be checked to meet the elevated water requirement.
Comparisons
- Mean solar radiation: 17.32 MJ/m²/day (≈ 4.81 kWh/m²/day)
Wind speed
Wind renews the air around leaves, so it raises evaporation and transpiration and enters the reference evapotranspiration calculation. Strong wind also matters for spraying and for mechanical damage.
AId Summary. Wind speed of 2.57 m s⁻¹ at 10 m height represents moderate aerodynamic resistance, which elevates evaporative demand for maize by enhancing the aerodynamic term in ET₀ calculations. This sustained wind can raise transpiration demand, especially when temperatures approach the crop's upper threshold of 30 °C. Managers should consider that such wind conditions may require adjustments to irrigation timing to meet the increased water demand.
Comparisons
- Mean wind speed at 10 m: 2.57 m/s
Wind direction and speed
The prevailing wind direction matters for windbreak placement, spray drift and the exposure of field edges.
AId Summary. Strongest winds on the day came from the southeast, consistent with the persistent SE dominance. The mean 10‑m wind speed of 2.57 m/s provides moderate air movement, while a peak of 4.94 m/s suggests occasional higher flow that could enhance evaporative demand. These conditions support routine transpiration but are below the threshold that would raise lodging risk for maize.
Comparisons
- Dominant direction: SE
- Mean wind speed at 10 m: 2.57 m/s
- Max daily mean wind speed at 10 m: 4.94 m/s